
Free Trading Journal for Futures and Prop Firm Traders
TradeRitual
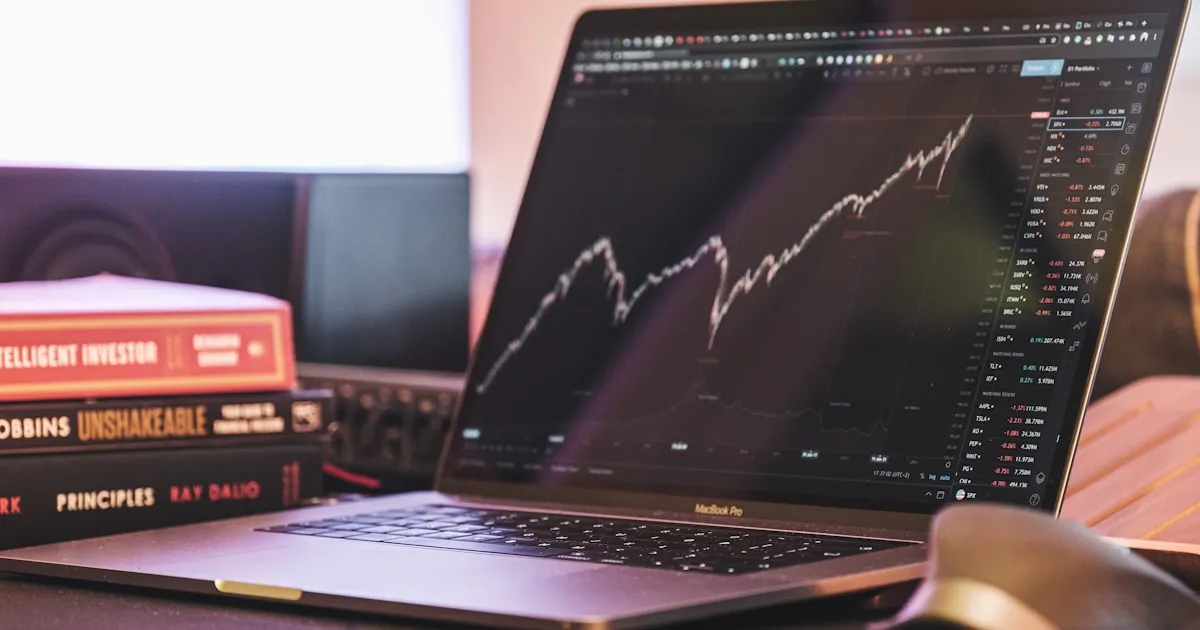
"In futures, a journaling mistake isn't a rounding error. It's a blown account."
Futures trading is a different animal. The leverage is real, the tick values change by contract, and if you're trading through a prop firm, there's an entire layer of rules sitting between you and your capital. A generic spreadsheet or equity-only journal doesn't cut it.
This guide covers what futures and prop firm traders specifically need from a trading journal, the metrics that actually matter for staying funded, and how TradeRitual handles the nuances without making you build formulas from scratch.
Why Futures Traders Need a Purpose-Built Journal
Most trading journals were designed for equities. You buy 100 shares of AAPL, sell them later, and the math is straightforward. Futures don't work that way.
Tick Values Vary by Contract
Every futures contract has its own tick size and tick value. Get this wrong in your journal and your P&L is fiction.
┌────────────────────────────────────────────────────────────┐
│ CONTRACT    TICK SIZE    TICK VALUE    POINT VALUE          │
│ ─────────────────────────────────────────────────────────  │
│ ES (S&P)    0.25         $12.50        $50.00              │
│ NQ (Nasdaq) 0.25         $5.00         $20.00              │
│ CL (Crude)  0.01         $10.00        $1,000.00           │
│ GC (Gold)   0.10         $10.00        $100.00             │
│ RTY (Russ)  0.10         $5.00         $50.00              │
│ YM (Dow)    1.00         $5.00         $5.00               │
│ 6E (Euro)   0.00005      $6.25         $125,000.00         │
│ ZB (Bonds)  1/32         $31.25        $1,000.00           │
│ MES (Micro) 0.25         $1.25         $5.00               │
│ MNQ (Micro) 0.25         $0.50         $2.00               │
└────────────────────────────────────────────────────────────┘
If you're journaling an ES trade and accidentally use NQ's multiplier, a 10-point winner looks like +$200 instead of +$500. Do that across a week of trades and your journal is useless for analysis.
Contract Multipliers Drive Everything
In equities, P&L is simply (exit - entry) * shares. In futures, the contract multiplier changes everything:
P&L = (Exit Price - Entry Price) * Contracts * Contract Multiplier - Fees
A 4-point move on ES with 2 contracts is 4 * 2 * $50 = $400, not 4 * 2 = $8. Your journal needs to know the multiplier for each instrument, or your analytics are meaningless.
Session Context Matters
Futures trade nearly 24 hours. But not all hours are created equal:
- Pre-market / Globex (overnight): Lower volume, wider spreads, different behavior
- Regular Trading Hours (RTH): 9:30 AM - 4:00 PM ET for index futures, different for commodities
- Post-market: Thin liquidity, gap risk
A trade taken at 2 AM during Asian session overlap behaves nothing like the same setup at 10 AM during RTH. If your journal doesn't capture session context, you can't analyze which sessions you actually trade well in -- and which ones are costing you money.
Leverage Amplifies Every Mistake
With ES margin around $500-$600 per micro contract intraday, you can control $10,000+ in notional value. That leverage works both ways. A journal that doesn't force you to confront your actual risk per trade in dollar terms (not just ticks) lets bad habits hide in plain sight.
What Futures Traders Should Track
Beyond the basics every trader journals (entry, exit, direction), futures traders need additional fields to make their data actionable.
1. Contract Type and Multiplier
Every entry should specify the exact contract. "Went long ES" isn't enough if you're also trading MES. The multiplier difference between ES ($50/point) and MES ($5/point) is 10x. Log both, and let the journal calculate P&L correctly.
2. Number of Contracts and Scaling
Did you enter with 3 contracts and scale out 1 at +8 ticks, then the remaining 2 at +16 ticks? That's not one trade -- it's a scaling event, and your average exit matters for accurate P&L. Track how many contracts you entered with, whether you scaled in or out, and at what levels.
3. P&L in Both Ticks and Dollars
Ticks tell you about your read. Dollars tell you about your risk management. A 10-tick winner on 1 MES contract is $12.50. That same 10-tick winner on 5 ES contracts is $2,500. Both had the same read quality, but wildly different risk profiles. Track both.
4. Session and Time of Day
Tag every trade with the session: pre-market, RTH open (first 30 min), RTH mid-day, RTH close, or overnight. After a month of data, you'll see patterns. Many futures traders discover they give back money consistently during the lunch chop or overnight sessions.
5. Daily P&L Running Total
This is non-negotiable for prop firm traders, but useful for everyone. Knowing your running P&L for the day -- updated after each trade -- tells you when you're approaching your personal stop or daily target. It's the difference between discipline and hoping.
6. Market Context and Catalysts
Was it FOMC day? NFP Friday? Triple witching? CPI release at 8:30 AM? Futures react violently to scheduled events, and your performance on event days vs. normal days is a critical split to analyze. A simple tag field handles this.
7. Max Adverse Excursion (MAE) and Max Favorable Excursion (MFE)
How far did the trade go against you before working? How far in your favor before you exited? These two metrics reveal whether you're leaving money on the table (low MFE capture) or taking on too much heat (high MAE relative to your stop).
Prop Firm Specific Tracking
If you're trading with a prop firm -- Topstep, Apex, FTMO, or any of the dozens of others -- your journal needs to track a layer that self-funded traders can ignore.
Daily Loss Limit Proximity
Most prop firms enforce a daily loss limit. Blow it, and you lose the account. You should know exactly how close you are to that limit at all times during the trading day.
Example: if your daily limit is -$1,000 and you're down -$650 after two trades, you need to see that you have $350 of room left before you take another position. This isn't optional -- it's survival.
Trailing Drawdown
Many prop firms use a trailing drawdown that follows your equity high. This is the rule that catches most funded traders. Unlike a fixed drawdown, a trailing threshold moves up as you make money but never moves back down.
┌────────────────────────────────────────────────────────────┐
│ DAY    P&L      EQUITY    DRAWDOWN FLOOR    ROOM LEFT     │
│ ─────────────────────────────────────────────────────────  │
│ 1      +$500    $50,500   $48,500           $2,000        │
│ 2      +$800    $51,300   $49,300           $2,000        │
│ 3      -$400    $50,900   $49,300           $1,600        │
│ 4      +$200    $51,100   $49,300           $1,800        │
│ 5      -$1,200  $49,900   $49,300           $600  ← DANGER│
└────────────────────────────────────────────────────────────┘
This is worth tracking closely yourself. Relying on the prop firm's dashboard alone -- which sometimes updates with a delay -- is a risk you don't need to take.
Consistency Score
Here's what trips up many funded traders: they pass evaluation with a few big days and a bunch of flat ones. Then in the funded phase, the prop firm's consistency rule flags them.
Prop firms want to see even distribution of profits, not one monster day carrying the account. Some firms explicitly require that no single day accounts for more than a certain percentage (often 30-40%) of your total profit.
Track your daily P&L distribution. If 60% of your monthly profit came from one Tuesday, you have a consistency problem -- even if the total looks great.
Phase Tracking
Your trading psychology and rules change based on where you are:
- Evaluation Phase 1: Hit the profit target without hitting the drawdown limit
- Evaluation Phase 2: Same, but often with a lower profit target (proving consistency)
- Funded Phase: Protect the account, stay within rules, reach payout threshold
- Payout Cycle: After first payout, maintain performance
Tag every trade with your current phase. Your win rate and approach during evaluation might be completely different from your funded behavior -- and that's important to know.
How TradeRitual Handles Futures
TradeRitual was built with multi-asset support from day one. Futures aren't an afterthought bolted onto a stock journal.
Futures as a First-Class Asset Type
When you log a trade and select "Futures" as the asset type, the journal knows to ask for the contract multiplier. The P&L formula automatically applies:
P&L = (Exit - Entry) * Quantity * Contract Multiplier - Fees
No manual formulas. No forgetting to multiply by 50 on your ES trades.
Contract Multiplier Field
Each trade stores its own contract multiplier. Trading ES and CL on the same day? Each trade calculates independently with the correct multiplier. You don't need separate spreadsheets or tabs for different instruments.
Analytics That Account for Leverage
The dashboard analytics -- win rate, profit factor, average winner/loser, expectancy -- all use the actual dollar P&L that includes contract multipliers. When you see your average ES winner is $387, that's the real number, not a per-point approximation.
Calendar View for Daily P&L
The calendar view shows your daily P&L at a glance. For prop firm traders, this is your consistency check. You can immediately see if your profits cluster on specific days or if they're spread across the month.
Notes for Session Context
Every trade has a notes field where you can log session context (RTH, overnight), market conditions (FOMC day, low volume), and prop firm phase (Eval Phase 1, Funded Week 3). This turns raw P&L data into reviewable context.
AI Assistant for Pattern Recognition
The AI assistant can analyze your trade history and flag patterns you might miss on your own -- like consistently poor performance during overnight sessions, or a tendency to over-trade after a winning morning. For prop firm traders, it can highlight consistency issues before they become a problem.
Free Starter Plan Covers the Basics
The Starter plan (free) includes core journaling with the contract multiplier field, trade logging, and essential analytics. You don't need to pay to start building your futures trading journal. Growth and Pro plans add more advanced analytics, additional accounts, and AI insights as you need them.
Common Futures Contract Reference
Bookmark this table. You'll use it when setting up trades in any journal.
┌──────────────────────────────────────────────────────────────────┐
│ CONTRACT         SYMBOL   MULTIPLIER   TICK SIZE   TICK VALUE   │
│ ──────────────────────────────────────────────────────────────── │
│ E-mini S&P 500   ES       $50          0.25        $12.50       │
│ E-mini Nasdaq    NQ       $20          0.25        $5.00        │
│ E-mini Dow       YM       $5           1.00        $5.00        │
│ E-mini Russell   RTY      $50          0.10        $5.00        │
│ Crude Oil        CL       $1,000       0.01        $10.00       │
│ Gold             GC       $100         0.10        $10.00       │
│ Silver           SI       $5,000       0.005       $25.00       │
│ Natural Gas      NG       $10,000      0.001       $10.00       │
│ Euro FX          6E       $125,000     0.00005     $6.25        │
│ 30-Yr Bonds      ZB       $1,000       1/32        $31.25       │
│ 10-Yr Notes      ZN       $1,000       1/64        $15.625      │
│ Micro E-mini SP  MES      $5           0.25        $1.25        │
│ Micro E-mini NQ  MNQ      $2           0.25        $0.50        │
│ Micro Gold       MGC      $10          0.10        $1.00        │
│ Micro Crude      MCL      $100         0.01        $1.00        │
└──────────────────────────────────────────────────────────────────┘
Note: Micro contracts are 1/10th the size of their full-size counterparts. They're popular with prop firm evaluation accounts where you want to manage risk tightly during the proving phase.
Practical Tips for Futures Journaling
Track by Session, Not Just by Day
Split your analysis by session. Create a habit of tagging each trade as RTH, pre-market, or overnight. After 50+ trades in each bucket, compare your stats. Most traders find one session where they consistently leak money.
Use Tags for Prop Firm Phases
Create simple tags: eval-1, eval-2, funded, payout. When you review your stats filtered by tag, you'll see how your behavior shifts across phases. Many traders get more aggressive in evaluation (chasing the target) and more timid when funded (afraid of drawdown). Both hurt performance.
Monitor Drawdown Daily, Not Weekly
Check your drawdown proximity before every session and after every trade. This takes 10 seconds with a proper journal. Without it, you're flying blind toward the one metric that can end your funded account instantly.
Log Contract Count Honestly
Scaling in adds risk. If you entered with 2 contracts, added 2 more, and your stop was based on the original 2-contract position, you just doubled your risk mid-trade. Journal the full scaling history so you can review whether your add-on behavior is helping or hurting.
Review Weekly with a Focus on Rules
Once a week, pull up your trades and ask one question: "Did I follow my prop firm's rules every single day?" Not "did I make money" -- that's secondary. Use your trade notes and tags to flag any day you approached or breached a limit.
Don't Ignore Commissions and Fees
Futures commissions are typically $2-$5 per round turn per contract. On a day where you trade 20 round turns, that's $40-$100 in fees alone. Over a month of active trading, fees can quietly eat into your edge. Track them per trade, and review total fees monthly.
The Bottom Line
Futures and prop firm trading demand more from your journal than stock trading does. The contract multipliers, the tick values, the drawdown rules, the consistency requirements -- these aren't nice-to-haves. They're the difference between staying funded and starting over with another evaluation.
A purpose-built journal that understands futures math and gives you accurate daily P&L to check against your prop firm's limits isn't a luxury. It's a basic tool of the trade.
If you're currently using a spreadsheet with manual multiplier formulas, or a journal designed for equities that doesn't know what a tick value is, you're making this harder than it needs to be.
TradeRitual handles futures natively -- contract multipliers, accurate P&L, drawdown analytics, and a free Starter plan to get you logging trades today. No credit card, no trial expiration on core features. Start building the data that keeps you funded.
Track your futures trades with proper contract math and prop firm awareness. Start journaling free at TradeRitual.