
Understanding Order Flow
TradeRitual
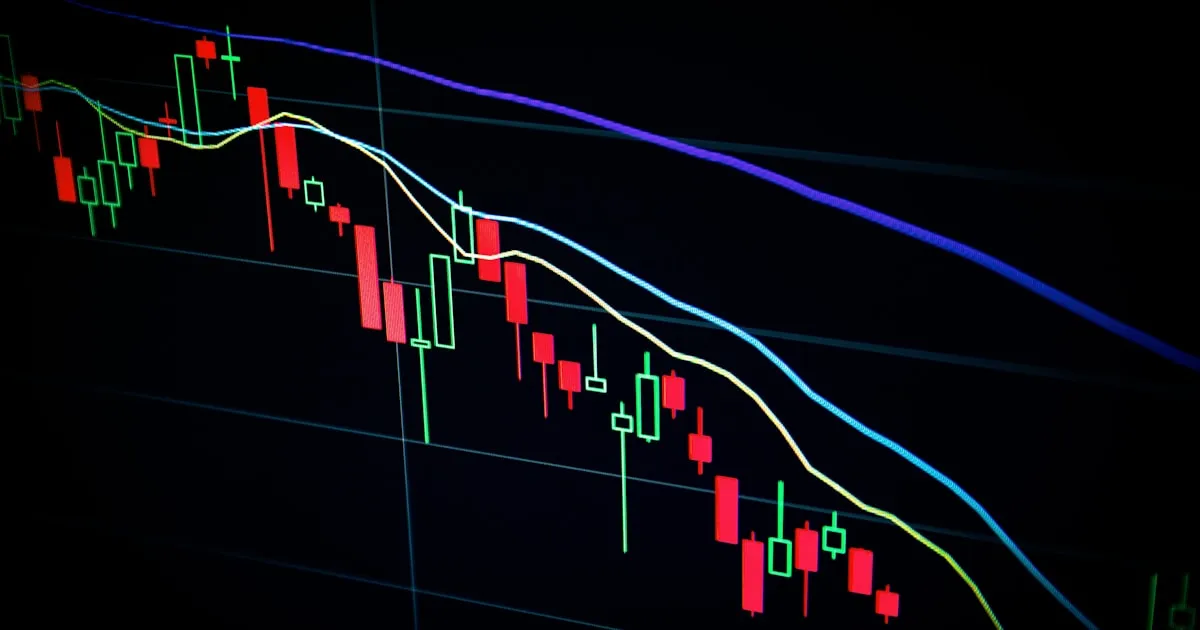
"Markets move because of a constant flow of buy and sell orders. Every price tick is the result of aggressive orders matching with passive liquidity." - Fabio Valentini, World Cup Trading Champion
Most retail traders stare at indicators while ignoring the fundamental truth: price moves when someone trades. Understanding WHO is trading, WHY, and HOW transforms your market perspective.
The Fundamental Truth About Markets
What Actually Moves Price
PRICE MOVEMENT EQUATION:
─────────────────────────────────────────────────────

Price moves UP when:
  Aggressive BUYERS > Available SELL orders

Price moves DOWN when:
  Aggressive SELLERS > Available BUY orders

Price stays FLAT when:
  Buy and Sell pressure are balanced
That's it. Everything else - indicators, patterns, news - only matters insofar as they influence this equation.
Indicators Are Lagging
Here's the uncomfortable truth:
THE INFORMATION CHAIN:
─────────────────────────────────────────────────────

1. Institutional decision is made
        │
        ▼
2. Orders enter the market
        │
        ▼
3. Price changes (orders filled)
        │
        ▼
4. Candlestick forms
        │
        ▼
5. Indicators update        ◄── Most retail traders look HERE
        │
        ▼
6. Retail traders react     ◄── Often too late
By the time your RSI or MACD signals, institutional traders have already acted.
Understanding Order Types
Passive vs. Aggressive Orders
ORDER TYPE COMPARISON:
─────────────────────────────────────────────────────

PASSIVE ORDERS (Limit Orders):
  "I want to buy at $100"
  - Waits at a price level
  - Provides liquidity
  - Doesn't move price
  - Shows INTENTION

AGGRESSIVE ORDERS (Market Orders):
  "I want to buy NOW"
  - Takes available liquidity
  - Moves price
  - Shows COMMITMENT
  - Real money voting
Key insight: Price movement requires AGGRESSIVE orders consuming PASSIVE liquidity.
The Order Book
SIMPLIFIED ORDER BOOK:
─────────────────────────────────────────────────────

         SELL ORDERS (ASKS)
         ─────────────────
$102.50  [████████████] 500 shares
$102.25  [██████████] 400 shares
$102.00  [████████] 300 shares    ◄── Best Ask
         ─────────────────
              SPREAD ($0.25)
         ─────────────────
$101.75  [██████] 200 shares      ◄── Best Bid
$101.50  [████████] 300 shares
$101.25  [████████████] 500 shares
         ─────────────────
          BUY ORDERS (BIDS)
To move price up: Aggressive buyers must consume all orders at $102.00, then $102.25, etc.
To move price down: Aggressive sellers must consume all orders at $101.75, then $101.50, etc.
Reading the Tape: Volume Analysis
Volume Confirms Movement
VOLUME INTERPRETATION:
─────────────────────────────────────────────────────

HIGH VOLUME + Price Up   = Strong buying (bullish)
HIGH VOLUME + Price Down = Strong selling (bearish)
LOW VOLUME + Price Up    = Weak rally (potential reversal)
LOW VOLUME + Price Down  = Weak selloff (potential reversal)
HIGH VOLUME + No Move    = Absorption (big players accumulating/distributing)
The Absorption Pattern
When price tries to move but can't despite heavy volume:
ABSORPTION EXAMPLE:
─────────────────────────────────────────────────────

Price attempts to break $100:

Attempt 1: 50,000 shares bought at $100   → Held
Attempt 2: 75,000 shares bought at $100   → Held
Attempt 3: 100,000 shares bought at $100  → Held

MEANING: Someone is selling every share buyers throw at $100.
         They have SIZE. This level is defended.

IMPLICATION: Until that seller is exhausted, price won't break $100.
Institutional vs. Retail Behavior
How Institutions Trade
Institutions can't trade like retail:
RETAIL TRADER:
─────────────────────────────────────────────────────
Want to buy 100 shares of AAPL?
→ Market order
→ Filled instantly
→ No price impact

INSTITUTIONAL TRADER:
─────────────────────────────────────────────────────
Want to buy 500,000 shares of AAPL?
→ Can't use single market order (would spike price)
→ Must break into smaller orders
→ Execute over hours or days
→ Try to hide true intentions
This creates footprints in the market that observant traders can spot.
Institutional Footprints
Signs of institutional activity:
| Signal | What It Means |
|---|---|
| Volume spike with small price move | Absorption (accumulation/distribution) |
| Price drifts up on increasing volume | Institutional accumulation |
| Price spikes down then recovers fast | Stop hunt followed by buying |
| Large orders on one side of book | Someone is showing (or hiding) size |
| End-of-day volume surge | Institutions adjusting positions |
The Three Phases of Price Movement
Phase 1: Accumulation
ACCUMULATION PHASE:
─────────────────────────────────────────────────────

                 ┌───────────────────┐
                 │   RANGE BOUND     │
Price:   ────────┤                   ├────────
                 │   (Institutions   │
                 │    buying quietly)│
                 └───────────────────┘
Volume:  ▃▅▃▅▆▅▃▅▆▅▃▅▃▅▆▅▃▅▃▅▆▅▃▅

Characteristics:
• Price in tight range
• Volume consistent or slightly rising
• False breakdowns that quickly reverse
• "Boring" looking chart
What's happening: Institutions are quietly buying without alerting the market.
Phase 2: Markup/Markdown
MARKUP PHASE:
─────────────────────────────────────────────────────

                              ╱╲
                             ╱  ╲
                            ╱    ╲
                           ╱      ╲
Price:          ╱─────────╱
               ╱
              ╱
─────────────╱

Volume:  ▃▃▃▃▅▆▇██▇▆█▇██▇█

Characteristics:
• Strong directional move
• Volume expands on moves in direction
• Pullbacks on low volume
• Trend is "obvious" (but often late to join)
What's happening: Institutions have their position. Now they want price to move.
Phase 3: Distribution
DISTRIBUTION PHASE:
─────────────────────────────────────────────────────

                 ┌───────────────────┐
                 │   RANGE BOUND     │
Price:   ────────┤   AT HIGHS        ├────────
                 │   (Institutions   │
                 │    selling to     │
                 │    late buyers)   │
                 └───────────────────┘
Volume:  ▃▅▆▅█▅▆▅█▅▆▅▃▅▆▅█▅▆▅

Characteristics:
• Price at highs but struggling
• High volume but no progress
• Bullish news doesn't push higher
• "Should be going up but isn't"
What's happening: Institutions are quietly selling to retail FOMO.
Practical Order Flow Concepts
Support and Resistance: The Real Reason
Support and resistance aren't magic lines. They're liquidity zones:
WHY SUPPORT WORKS:
─────────────────────────────────────────────────────

$100 is "support" because:

1. Previous buyers at $100 remember that level
2. They place new buy orders there
3. Accumulated buy orders create a "wall"
4. Price bounces because buy orders > sell orders

When support BREAKS:

1. Those buy orders become stop losses
2. Stop losses trigger = more selling
3. Previous buyers now selling = acceleration
4. Price falls quickly through
Stop Hunts: Institutional Hunting Ground
STOP HUNT ANATOMY:
─────────────────────────────────────────────────────

                 $102 ────────────────
                       Retail stops ▼
       Price    $101 ═══════════════════
       Level    $100 ────────────────────
                       Support

STOP HUNT:

1. Institutions see stops clustered below $100
2. They push price below $100 briefly
3. Retail stops trigger (forced sellers)
4. Institutions buy this supply at discount
5. Price reverses and rallies

           $100 ─────╲    ╱─────────
                      ╲  ╱
            $99 ───────╲╱ ◄── Stop hunt
                        Institutions buying
Lesson: Obvious stop levels get hunted. Don't put stops at obvious levels.
Applying Order Flow Thinking to Your Trading
Before Entry: Ask the Right Questions
ORDER FLOW ENTRY CHECKLIST:
─────────────────────────────────────────────────────

□ Where is liquidity? (Where are stops?)
□ Who benefits from a move in my direction?
□ What would need to happen for price to go my way?
□ Where would institutions be buying/selling?
□ Is volume supporting the move?
During Trade: What to Watch
DURING TRADE MONITORING:
─────────────────────────────────────────────────────

BULLISH SIGNS:
• Volume increases on up moves
• Pullbacks on light volume
• Higher lows forming
• Dip buying visible

BEARISH SIGNS:
• Rallies failing on high volume
• Heavy selling into strength
• Lower highs forming
• Bounces sold immediately
After Trade: Order Flow Review
POST-TRADE ORDER FLOW REVIEW:
─────────────────────────────────────────────────────

1. Where did the real buying/selling happen?
2. Did I trade WITH or AGAINST institutional flow?
3. Were my stop placements logical given liquidity?
4. What order flow signals did I miss?
Common Retail Mistakes (Order Flow Perspective)
Mistake #1: Chasing Breakouts
THE BREAKOUT TRAP:
─────────────────────────────────────────────────────

RETAIL SEES:                    INSTITUTIONS SEE:
"Breakout! Buy!"               "Retail buying the top.
                                Time to distribute."

Price: ────────╱╲
              ╱  ╲
             ╱    ╲ ◄── Retail buys
            ╱      ╲
───────────╱        ╲──────────
                     ╲
                      ╲ ◄── Institutions sell to retail

SOLUTION: Wait for breakout CONFIRMATION
          (Retest of breakout level with volume)
Mistake #2: Obvious Stop Placement
STOP PLACEMENT ERROR:
─────────────────────────────────────────────────────

"Support" at $100
Retail places stops at $99.50

              ▼ 10,000 stop orders at $99.50

This is a LIQUIDITY MAGNET for institutions.
They WILL come for these stops.

SOLUTION: Place stops at less obvious levels,
          or use wider stops with smaller size.
Mistake #3: Ignoring Volume Divergence
VOLUME DIVERGENCE WARNING:
─────────────────────────────────────────────────────

PRICE:    ╱╲    ╱╲    ╱╲
         ╱  ╲  ╱  ╲  ╱  ╲  (Higher highs)

VOLUME:  ██   █▇   ▆▅   ▃▂  (Decreasing volume)

WARNING: Price rising but fewer buyers each time.
         Rally running out of fuel.
         Potential reversal incoming.
Journaling with Order Flow in Mind
When using TradeRitual, add order flow observations:
ENHANCED TRADE JOURNAL ENTRY:
─────────────────────────────────────────────────────

Symbol: AAPL
Entry: $175.50
Exit: $177.25

STANDARD NOTES:
Breakout above resistance, target hit.

ORDER FLOW NOTES:
• Volume expanded 2x on breakout bar
• Retest of $175 held with buying
• No selling into strength after break
• Distribution signs at $177.50 (took profit)

ORDER FLOW GRADE: A
(Traded with the flow, not against it)
Resources for Order Flow Education
Free Resources
- YouTube: Order flow trading tutorials
- TradingView: Volume profile indicator
- Books: "Mind Over Markets" by Dalton
Advanced Tools
- Bookmap: Visual order book analysis
- Sierra Chart: Footprint charts
- Jigsaw Trading: DOM and order flow tools
Education
- Orderflow trading courses (various providers)
- Wyckoff method resources
Key Takeaways
- Price moves because of order flow - Everything else is secondary
- Aggressive orders move price - Market orders consuming limit orders
- Institutions leave footprints - Volume, absorption, stop hunts
- Think like an institution - Where is liquidity? Who benefits?
- Journal your observations - Build pattern recognition over time
Your Order Flow Challenge
This Week
- Before each trade, identify where stops are likely clustered
- Note volume on every candle during your trades
- After each trade, write one order flow observation
This Month
- Review trades for order flow mistakes
- Identify your best trades - was order flow supportive?
- Identify your worst trades - were you fighting the flow?
Track your order flow observations in TradeRitual: Sign up free at traderitual.app
Discuss order flow concepts: Join our Discord community
Next up: "Position Sizing: The Most Important Skill Nobody Talks About"